How to measure trade show ROI with digital business cards
A founder's method for proving a show paid off: run a time-boxed campaign, count scans, leads and deals per person and QR code, and compare with the cost.
The question came in a budget meeting, not at the show: "The stand was nine and a half thousand. What did we get?" I had scans in one tool, leads in a shared list, a few deals I was fairly sure had started at the booth, and no way to put the three on one page without a spreadsheet and an afternoon. I run a lead-capture company and I could not produce the number for my own event. This article is the method I use now, so that the number exists the morning after the show closes.
I am the founder of namponi, a platform for digital business cards, smart QR codes and AI card scanning. The measurement method works with any stack that gives you scan counts and a shared lead list; the screenshots show the campaign tooling in namponi, because that is what I use. If your team does not yet capture leads digitally at the booth, start with the capture playbook; this piece picks up where it ends.
Why is trade show ROI so hard to measure?
Trade show ROI is hard because the activity is spread across several people, several days and several channels, and nobody draws a boundary around it at the time. Scans land in one place, cards in pockets, leads in a list a week later. When someone finally asks what the show produced, the data has no edges and no owner.
The usual fix is to ask everyone to tag every lead with the show name. In my experience that works for the first morning. By the afternoon of day two a third of the leads carry no tag, and the ones that do are the easy ones. Tagging depends on the busiest person at the busiest moment remembering to do admin.
The alternative is to define the boundary in advance and let the counting follow from it: a time window, the people on the booth, and the QR codes on the stand. Anything they do inside that window counts. Nothing needs tagging, and when two events overlap, say a regional roadshow inside a quarter-long push, each one counts what falls inside its own window and team.
What should you actually count?
Count five things, in this order: scans of your team's cards and booth QR codes, the unique visitors behind those scans, leads captured and created, how many of those leads moved forward, and deals closed within a defined period afterwards. The first three exist on the day; the last two are what you report a quarter later.
| Metric | What it tells you | When it is useful |
|---|---|---|
| Total scans and unique visitors | Footfall that reached a phone, not just the stand. Unique visitors strip out the colleague who scanned you four times. | During the show, per day and per hour |
| Card scans vs QR scans | Whether people are meeting your team or finding the stand on their own | During the show, to adjust signage and staffing |
| Leads captured vs created | Captured: someone filled in your card's form or exchanged contacts. Created: your team scanned a paper card or added someone by hand. Kept separate so nothing double counts. | Evening triage |
| AI card scans and how many became leads | How much of the paper you collected actually turned into a record you can follow up | Evening triage |
| Lead conversion and deals closed | Leads that moved through your pipeline, and the revenue that came out | 30 and 90 days after the show |
Two rules keep the numbers honest. Compare every figure with the same length of time just before the show, so a "big" scan count is read against your normal week rather than against zero. And never let one person count twice: a visitor who scanned the booth QR code and then handed over a paper card is one lead, captured once.
How do you set up a campaign before the show?
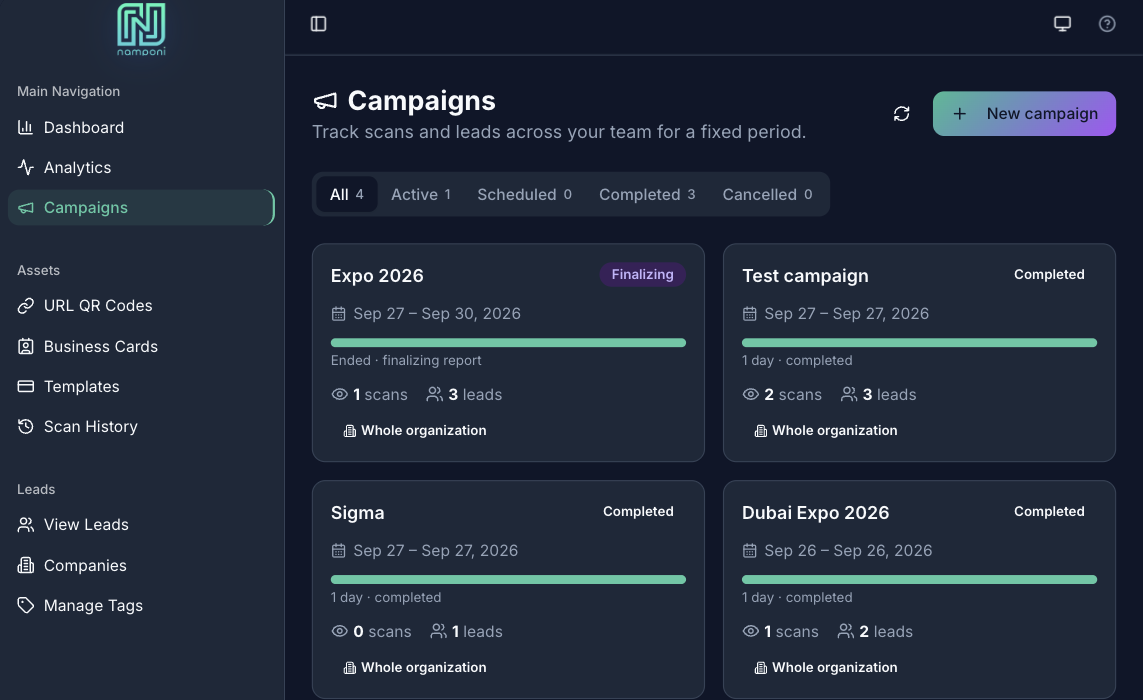
Create one campaign per show, with a start date, an end date, the people who will be on the stand, and the QR codes that will be printed. In namponi this lives on the Campaigns page of the web dashboard, on the Pro and Enterprise plans; it takes about a minute and the rest of the measurement is automatic from there.
What I set, and why:
- Dates. The show days, plus the set-up day if the team will already be meeting people. Metrics cover the whole of each day in your timezone.
- Who takes part. Either the whole organisation or specific member groups. I keep a Booth team group under Users and reuse it from show to show. Anyone added to the group mid-show is counted from then on.
- Which cards. Each person's default card, or all of their cards. Default is right for most teams; the form shows how many cards that currently means.
- Booth QR codes. The codes printed on the stand, the table tents and the slide deck. Each one is a separate line in the results, which is how you learn that the code at the coffee point outperformed the one on the back wall.
- Leads and card scans. Leads captured through the tracked cards, leads the team creates, and AI card scans are on by default. I leave them on.
- Who gets the report. The whole organisation, or just the participants and admins. For a sales push I send it to everyone; it is the fastest way to make the next show feel like a team event.
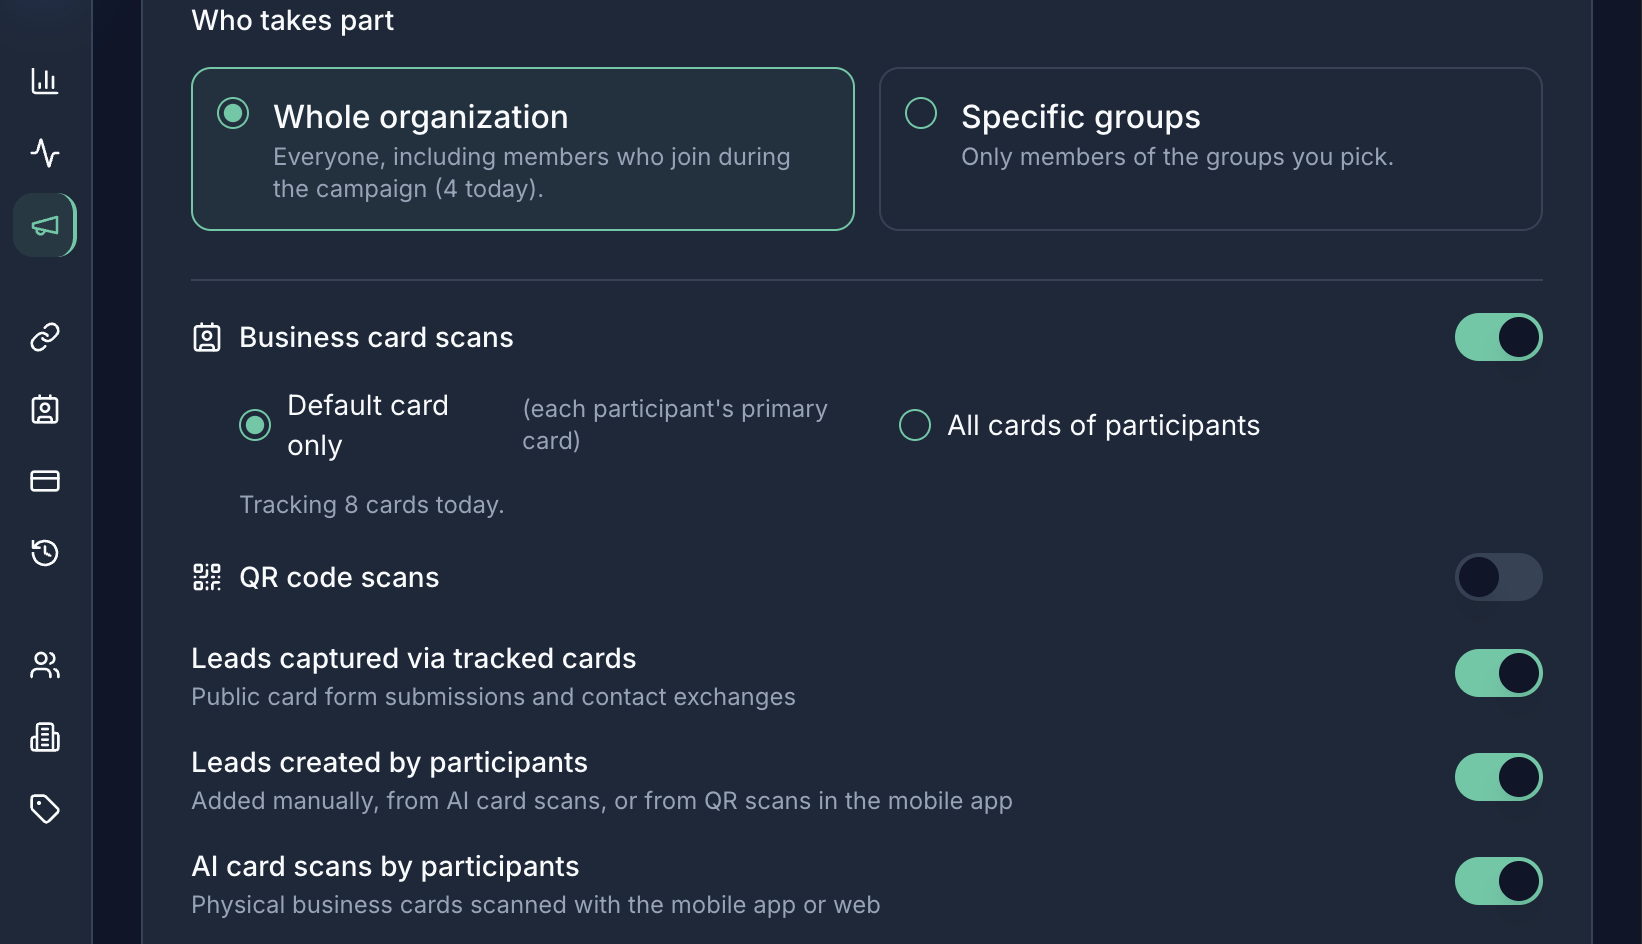
Groups are the part I would not skip. Campaigns in namponi never target individual users, because that list is wrong the moment someone joins or leaves. A group such as Booth team or Sales EU is set once, assigned when you invite people, or created automatically from a Microsoft Entra import, and every later campaign simply points at it. For roles, shared lists and the rest of the team setup, see the events use case.
What should you watch while the show is running?
Watch three things live: scans and unique visitors against the previous period, the hourly activity chart, and leads captured per person. Everything else can wait for the evening. The only reason to look during the show is to move a sign, move a person, or remind someone to scan while it still changes the result.
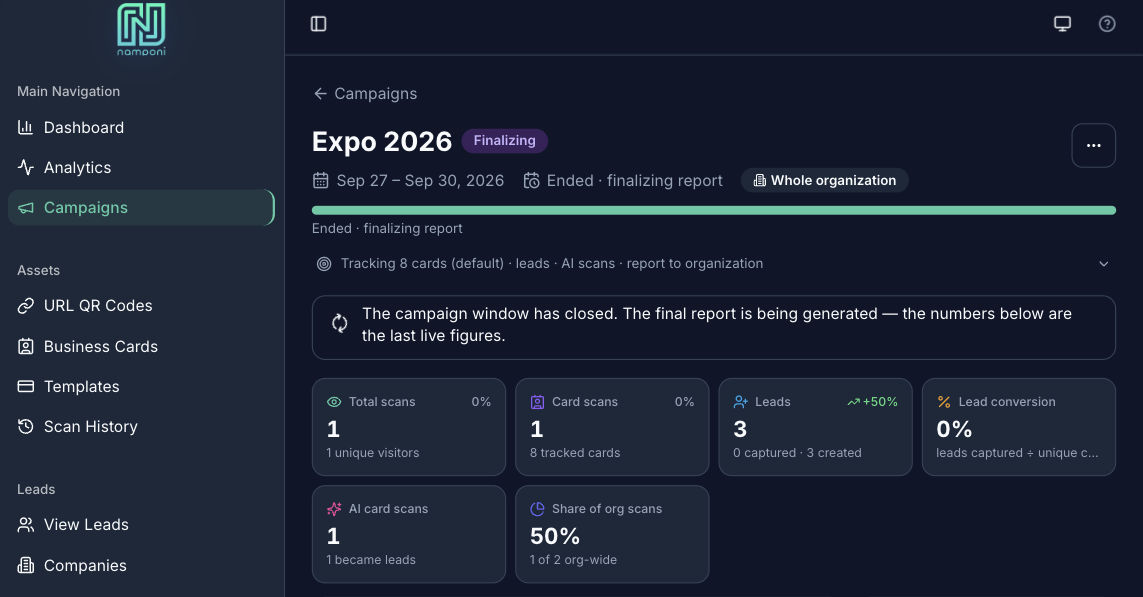
The live campaign page shows a strip of headline numbers, each compared with the same length of time before the campaign started, whenever that period had activity to compare against. Below it: daily and hourly activity, top performers by card and by QR code, a leaderboard per person and per group, and a set of highlights, such as the peak hour or the top country, computed from your own data by plain rules. The numbers refresh whenever you open the page or press Refresh now.
| When | What I look at | What I change |
|---|---|---|
| Morning of day one | Scans on each booth QR code | If the banner code is flat, move the sign to where people queue |
| Lunchtime | Leads captured per person | Pair whoever has zero with whoever has ten for the afternoon |
| Evening | Hourly chart, AI card scans that became leads | Staff the busy hours tomorrow; fix scans that came back unreadable |
| Last day | Unique visitors versus the previous period | Decide whether this show earns a slot next year before you leave the hall |
I do not use the leaderboard to rank people. I use it to notice that one position on the stand produces more conversations than another, or that one person's QR code is on a flyer that is quietly working. When a campaign targets groups, the per-group rollup also tells you whether the partner team you invited actually showed up.
How do you turn the final report into an ROI number?
When the window closes, freeze the numbers, put the full cost of exhibiting next to them, and compute cost per lead and cost per meeting. Then revisit the same report after thirty and ninety days to add meetings and deals. The ROI figure is the deal value from the show set against the full cost, and it only exists if the numbers were frozen when the show ended.
In namponi the freeze is automatic. The morning after the end date the metrics are snapshotted, the campaign is marked completed, and the report below lands in the inbox of everyone you chose, with the same totals, top performers, highlights and team leaderboard as the page. If the show finishes early, End now freezes the numbers immediately and asks whether to send the report straight away or not at all. The snapshot never changes afterwards, which is what makes it something you can hand to finance.
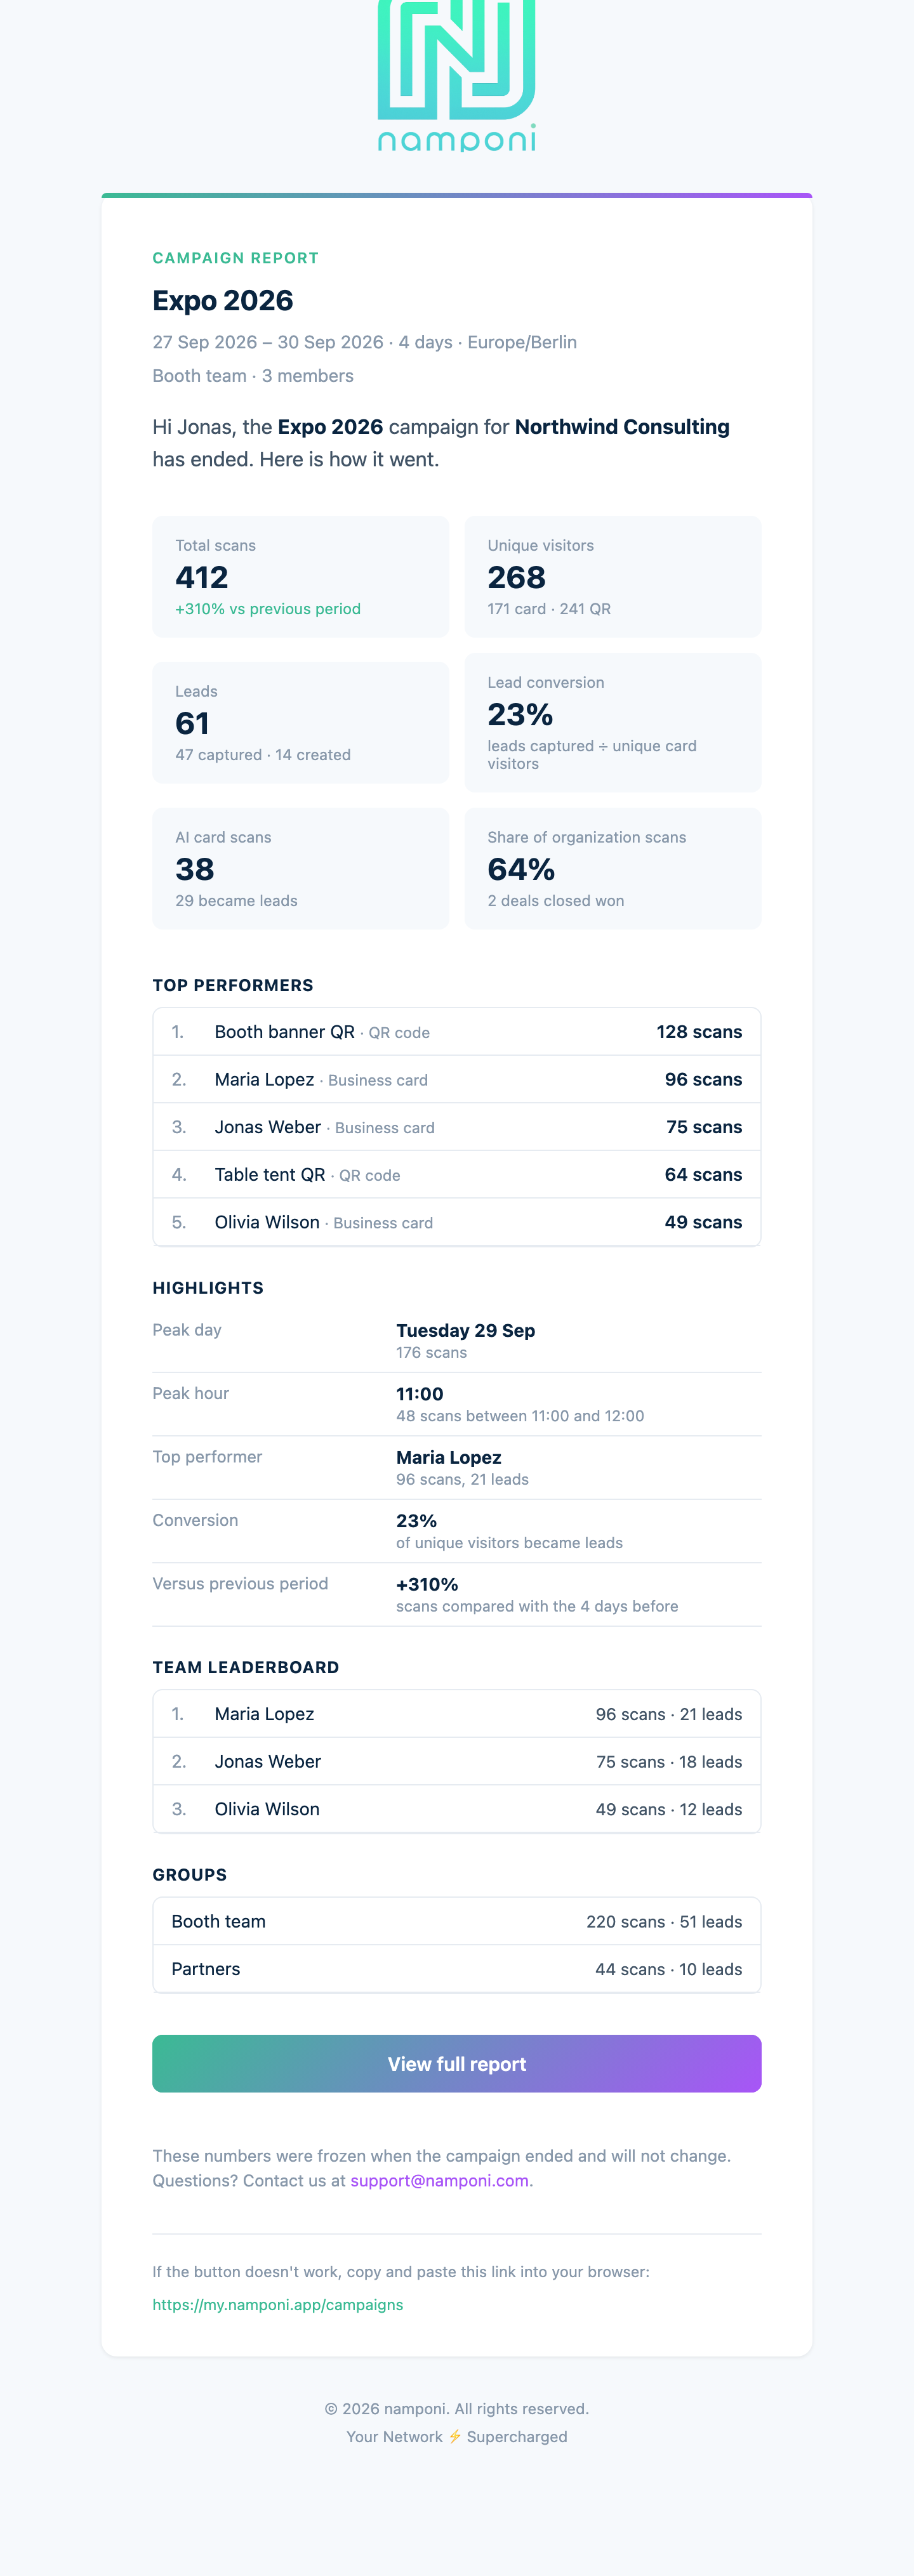
Here is the arithmetic for the fictional show in that report, with illustrative numbers that are not a benchmark:
| Line | Example |
|---|---|
| Stand, build and shipping | €5,000 |
| Travel and hotels for three people | €2,800 |
| Three people, three days, loaded day rate | €1,800 |
| Total cost of exhibiting | €9,600 |
| Scans / unique visitors (from the report) | 412 / 268 |
| Leads captured + created (from the report) | 47 + 14 = 61 |
| Cost per lead | €157 |
| Meetings booked within 30 days | 9 |
| Cost per meeting | €1,067 |
| Deals closed within 90 days, annual value | 2 × €4,000 = €8,000 |
| ROI at 90 days | (8,000 − 9,600) / 9,600 = −17% |
That last line is the honest version of most first measurements: at ninety days the show has not yet paid for itself, and whether it does depends on the seven meetings still open. It is a far more useful sentence than "we met loads of people", because it says exactly what has to happen next, and it gives you a cost per meeting to set against every other channel you run.
Two habits move those open meetings. The first is speed: the report arriving the morning after the show is the cue to send the follow-ups that day, not next week, which is the whole argument of the capture playbook. The second is keeping the attribution window fixed.
What about the colleagues who were not at the booth?
Count them separately, or not at all, but decide on purpose. A campaign that follows only the Booth team group tells you what the stand produced; a campaign over the whole organisation for the same dates tells you what the company produced that week. Both are valid, and because campaigns can overlap you can run both and compare the two.
Whole-organisation is also the right mode for small teams, where everyone is effectively on the stand, and for a product launch, where the "event" is a date range rather than a place. No participant list is stored at all in that mode, which is why it costs nothing to run for a large organisation either.
One detail that matters at scale: a card still gets its credit after the show even if the person later leaves or the card is deactivated, because the snapshot was taken when the window closed. People change jobs; the number you reported does not.
The ROI worksheet
Everything above fits on one page. Fill the left column before the show, the middle column the morning after, the right column at ninety days.
| Before the show | Morning after | At 90 days |
|---|---|---|
| Campaign created: dates, booth group, cards, every printed QR, report recipients | Report received; full cost written next to it | Meetings and deals from the show, inside the fixed window |
| Full cost of exhibiting agreed, including team days | Cost per lead = cost ÷ (captured + created) | Cost per meeting and ROI against total cost |
| Attribution windows fixed: 30 days meetings, 90 days deals | Top QR code and top performer noted for next time | Decision: go back, change the stand, or skip it |
Campaigns and member groups are part of the Pro and Enterprise plans; scans, card analytics and the lead list are available on every plan, including Free, so the capture side of this routine costs nothing to try. If you measure your next show this way, I would like to hear what the number turned out to be, especially if it was uncomfortable. The contact page or the namponi LinkedIn page both reach me.
Frequently asked questions
What is a good trade show ROI?
There is no universal benchmark, because stand cost, deal size and sales cycle differ wildly between industries. Compare the show against your own alternatives instead: cost per qualified lead and cost per meeting versus what the same money produces in outbound or paid channels, and whether pipeline from the show pays back within a quarter or two.
How do I attribute a lead to a specific trade show?
Decide the window and the people before the show starts, then count every scan, lead and card scan that happens inside that window and belongs to those people or to the booth QR codes. Doing it by time window and team, rather than by asking people to tag each lead, means nothing is missed and two overlapping events can each count their own results.
Do I need the whole team to use the same tool?
Yes, for the duration of the show. If three people scan into one list and two keep paper, you can only measure the three. One shared organisation, one card per person and one booth QR code is the minimum for a number you can trust.
Which metrics matter most on the day of the show?
Scans and unique visitors on the booth QR code tell you whether the stand placement works; leads captured per person tell you whether the conversations are being recorded; the hourly chart tells you when to staff up. Conversion and deals only make sense weeks later.
Can I measure a show after it has already happened?
Partly. If your team used digital cards and a shared lead list during the show, a campaign window set over those dates will count the scans and leads retroactively, because attribution is by time and participant rather than by tagging. What you cannot recover is context nobody wrote down.